|
1
|
|
2
|
Click Number Formatting.
|
|
4
|
In the Number Scale Value box, enter 60,60,24,7.
|
|
5
|
In the Number Scale Unit box, enter min,hr,day,wk.
|
|
6
|
Click Save.
|
|
1
|
|
2
|
Click Number Formatting.
|
|
3
|
|
4
|
|
5
|
Click Save.
|
Figure 28. 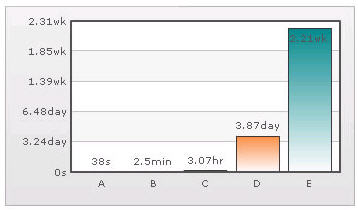 Time scaling
Time scaling