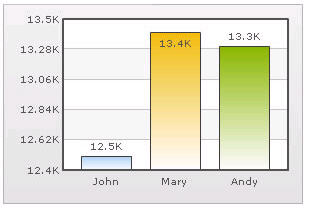
Setting Number Scaling Number scaling lets you define your own scales for numbers and then apply it to all numbers on the chart. For example, if your numbers on the chart are greater than 1000, qSIChartView scales them to K (Thousands) or M (Millions). For example, if you plot a chart with data as 12500, 13400 and 13300, you will see the following chart: Figure 26. Setting number scaling qSIChartView has scaled the numbers down to K. By default, qSIChartView has the K,M (1000,1000) scaling defined for each chart. You can, however, customize it. You can perform the following procedures: • Adding Billions to Default Scaling • Putting Time in Scale