qSIChartView : qSIChartView Procedures : Setting Number Scaling : Adding Billions to Default Scaling

Adding Billions to Default Scaling
qSIChartView, by default, has 1000,1000 (K,M) scaling defined for all charts. It does not have the scaling for billions defined. You can modify the number scaling to add billion so that the final scale looks like 1000,1000,1000 (K,M,B).
This scale would look something like:
To convert this scale into qSIChartView format
1
2
Click Number Formatting.
3
4
5
Click Save.
Whatever numeric figure was present on the left hand side of the table is put in Number Scale Value and whatever unit was present on the right side of the scale table has been put under Number Scale Unit - all separated by commas.
If you want to set the chart formatting flags
1
2
Click Number Formatting.
3
4
5
6
Click Save.
When you now view a chart containing data in billions, you will see the following chart. Note that the chart now contains figure both in millions and billions.
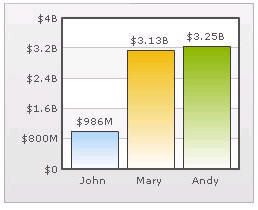
Figure 27. Setting chart formatting