qSIChartView : qSIChartView Pages : Content Page : Primary Content

Primary Content
The Primary Content page is default category. You need to configure one or more elements in this page to get started using this web part.
Primary Content contains the following:
 
Table 1. Display
See Catalog for more information.
See Configuration for more information.
Catalog
This property defines the entity and the operations related to the entity.
 
The Catalog section contains one or more entities. An entity identifies which system and service you have defined in the Configuration Editor. An entity contains one or more operations that can be executed on the entity, and consists of the following attributes:
 
Table 2. Catalog
Operations
An operation contains the following properties.
 
Table 3. Operations
Operation Parameters
You can click Edit to add parameters to your operation. You can define the following:
 
You can define one or more Property elements.
Table 5. Properties
Configuration
This property defines how the data should be grouped in the X Axis and the data series for the chart.
The Configuration element should contain only one X Axis and one Series element. Each Series element may contain one or more Items element.
Configuration Properties
The Configuration section contains the following properties:
 
Data Series
You can define a data series for the chart by configuring the following properties:
 
Table 7. Data Series
Allows you to define the chart type for this series when you use one of the combination chart in the Chart Type property. The choices are: COLUMN, AREA or LINE. This attribute is ignored for any non-combination chart type
Examples of Configuration Property
The following is an example of the Configuration property if you want to display data from your Sales list. Your Sales list contains the sales amount for every month in the year. There are 3 fields in the list: Year, Month and Amount. For example, say you want to display the month in the X axis. You also wants to create the data series dynamically based on the year field.
If you are using Advanced Mode, here is the XML:
<Configuration>
    <Series>
     <Items FieldName="Amount" AggregateFunction="Sum" ChartSeriesType="COLUMN" FilterFieldName="Year" />
    </Series>
    <XAxis FieldName="Month" SortFieldName="Month" />
</Configuration>
The following shows the resulting chart:
Figure 1. 
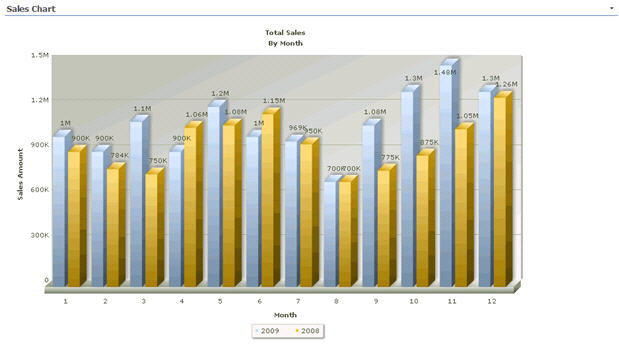
Configuration property chart