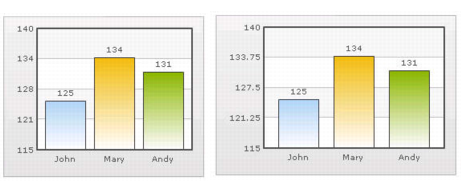
Formatting Y-axis Values Decimal in Manual Div-Lines Mode If you want to set the number of divisional lines on chart, you can control the decimals of y-axis values separately. For example, consider the following attributes and chart: Y Axis Min Value='115' Y Axis Max Value='140' Zero Plane=false Number of Division Lines='3'> In this chart, the chart lower limit, upper limit, and number of divisional lines have been manually set. qChartView will not automatically adjust divisional lines. In the chart, qChartView has truncated decimals from y-axis values, as it cannot find any other decimal values on the chart. You can, however, show decimals on y-axis values in this case (when Zero Plane is false) using Y Axis Value Decimals attribute, for example Y Axis Min Value='115' Y Axis Max Value='140' Zero Plane=false Number of Division Lines='3' Y Axis Value Decimals='2' Decimals='0' >. NOTE: Force Decimals does not work in this mode. When you now see the chart, 2 decimal places on y-axis values appear. But, the other numbers on chart would still have 0 decimal places. Figure 25. Formatting y-axis