qChartView : qChartView Procedures : Setting Number Formatting : Controlling Decimal Precision

Controlling Decimal Precision
All the charts types in qChartView support the attribute decimals. This single attribute lets you control the decimal precision of all the numbers on the chart. Using this attribute, you can globally set the number of decimal places of ALL numbers of the chart.
To globally set the number of decimal places
1
2
Click Number Formatting.
3
4
Click Save.
For example, if you have numbers on your chart as 12.432, 13.4 and 13 and you set Decimals='2' , the numbers would be converted to 12.43, 13.4 and 13 respectively.
Figure 18. Controlling decimal precision
Similarly, if you had data as 0.12342, 0.134 and 0.13, and you set Decimals as 3, qChartView would output 0.124, 0.134 and 0.13 respectively.
Even though the Decimals is set to 3, qChartView does not add the 0 padding to 0.13 to form 0.130. However, if you want your numbers on the chart to have trailing zeroes too, you can set Force Decimals=true and now the numbers would show as 0.124, 0.134 and 0.130 respectively, as shown in these examples:
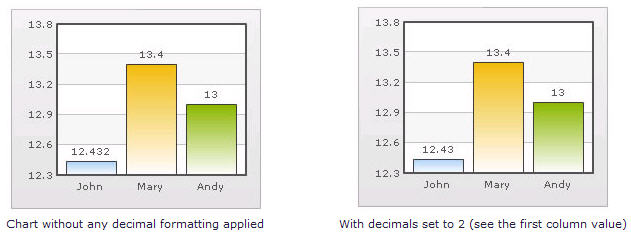
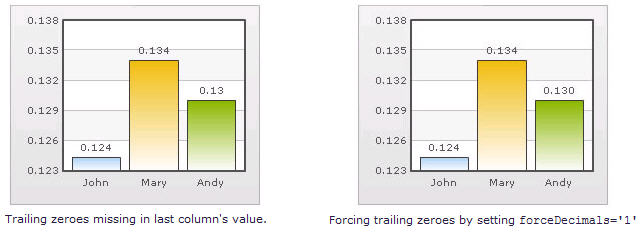
Figure 19. Force decimals